Kitchen Diary®
A database of daily dining records to support food marketing that considers both dining trends and seasonality
Service Outline
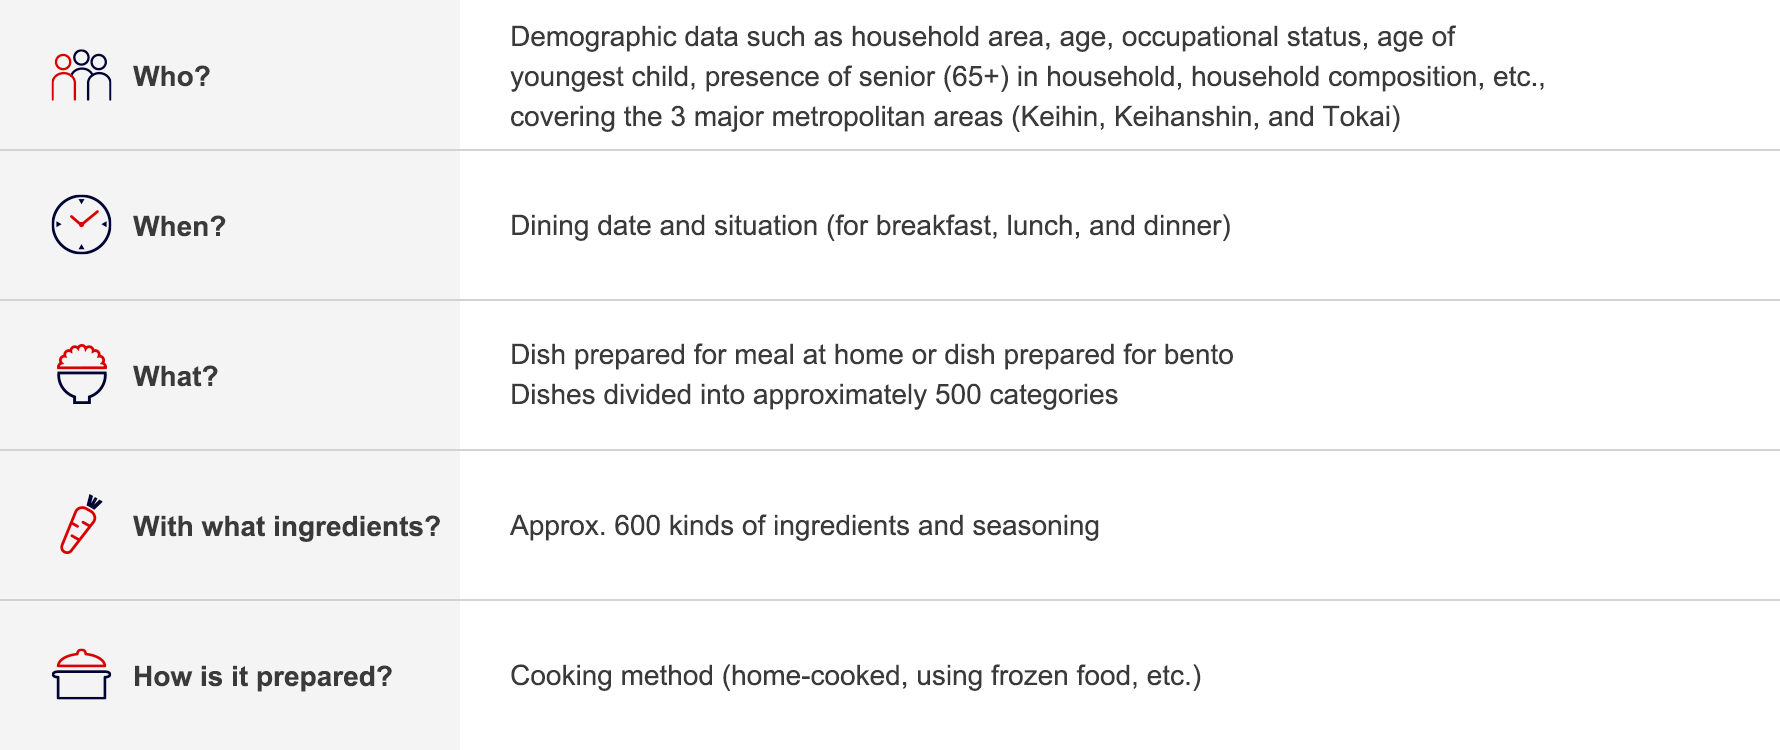
Kitchen Diary is a dining table database that tracks the dining and cooking conditions of 1,260 households in the Keihin, Keihanshin, and Tokai regions for each meal (breakfast, lunch, and dinner), with information on:
- When the dish is eaten (season, day of week, ”event” status, meal), what kind of dish it is, what ingredients and seasoning are used, and what cooking method is used
- Differences between areas in terms of food preferences and eating habits, and differences in dining habits by panelist profile (age, occupational status, family composition, etc.)
- Qualitative information on cooking methods, such as whether it was made from scratch or by using frozen foods, as well as areas of particular attention entered by panelists themselves, which can be useful for the development of new products that satisfy hidden needs
Kitchen Diary can be used for analysis of dining trends, for inspiration in developing new food products, and for sales promotion proposals targeting distribution channels.

Characteristics of Kitchen Diary
365 days of dining information, capturing the scenes, dishes, cooking methods, and ingredients used
Because data is collected continuously for 365 days, changes in dining can be examined through a wide range of factors such as season, temperature, special vs. daily occasion, weekday vs. weekend/holiday, etc.
Sample configuration capturing the 3 major metropolitan areas of Japan
Since the three major metropolitan areas of Japan – Keihin (Greater Tokyo), Keihanshin (Kyoto, Osaka, and Kobe), and Tokai (Shizuoka, Aichi, Gifu, and Mie prefectures) – are covered, you can conduct food marketing that captures regional characteristics and regional differences in food due to climate and culture.
High scalability through supplementary research
As an optional service, Kitchen Diary can be linked with consumer panel (SCI®) purchase information or combined with ad-on research to analyze dining habits of heavy users, light users, and non-users of specific categories.
Deliverables
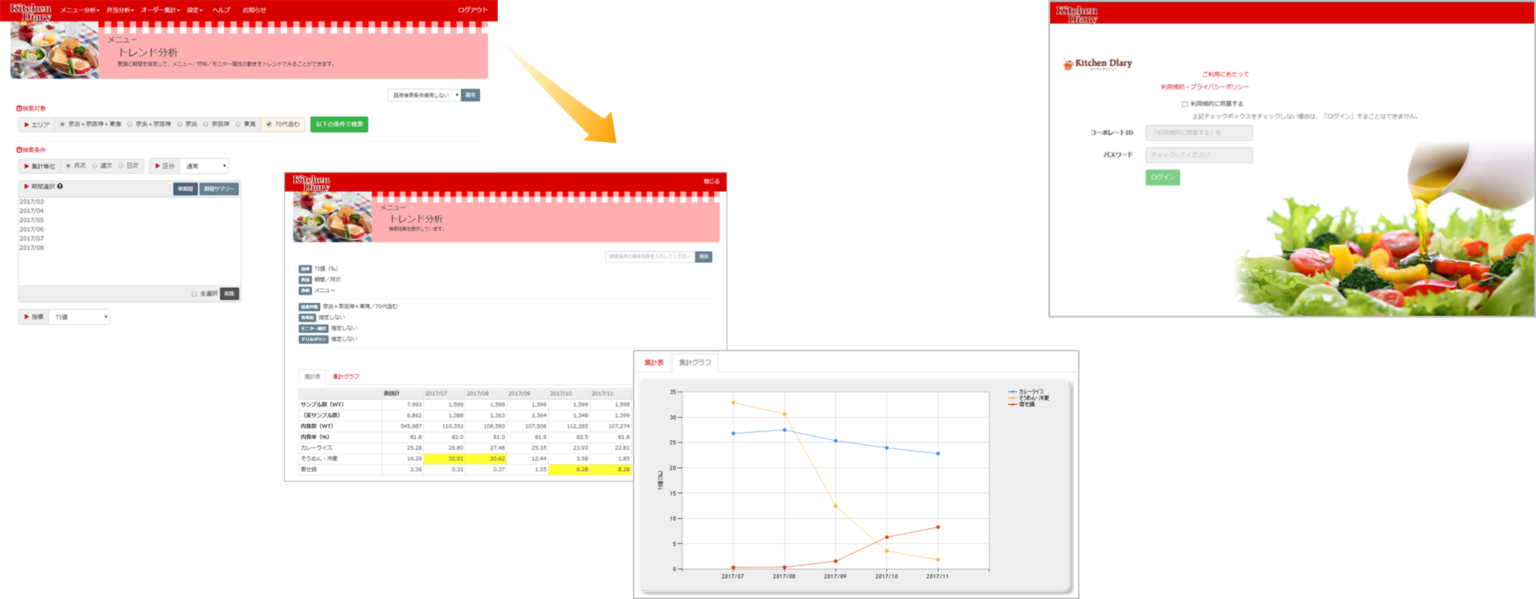
Users can freely tabulate and analyze data using “Takumi-kun”, a web-based tabulation platform for Kitchen Diary.