
What we can do
Japan-born No. 1 Marketing Research Agency in Asia
Supporting clients' global expansion via Asia's top-tier research experience and invaluable local insights
How do we do it -
Our 4 pillars of success
-

Locally Present
Our team consists of experienced professionals with deep knowledge of local cultures and customs worldwide, enabling us to adapt flexibly to each market’s unique needs.
-

Rich Industry Knowledge
Serving clients in diverse industries such as manufacturing, services, retail, finance and more, we deliver research-backed insights to fuel global success.
-

Expertise beyond traditional marketing research
From expert interviews to social listening, our multi-faceted research approach delivers intelligence that empowers businesses to adapt and grow in a fast-changing world.

Quality Focused
With local offices in ten countries and a vetted research network in 60+ markets, we maintain the highest standards in global insights.
INTAGE is
your proven partner
For over six decades, INTAGE has been Asia’s leading marketing research agency, trusted across the region and beyond.
Conducting over 6,500 projects annually in more than 60 countries, we bring extensive research expertise in key markets such as Asia, Europe, and the U.S., as well as emerging regions like the Middle East and Africa.
Backed by a strong global network and 9 offices across Asia, we bridge you to the voices shaping markets. Our tailored research delivers actionable insights that align with your goals—whether launching a product or refining strategy, we help you navigate global markets, connect with your audience, and drive success.
Transforming data into
actionable insights: Our offerings
-
Online Research
Survey research conducted on the internet
-
Lyche-Board
Easy tabulation and processing of survey data on your web browser
-
Survey Panel in Japan
Mighty Monitor, one of the largest high quality survey panels in the industry
*Japan Market Offering
-
Sub-panels in Japan
Detailed survey monitor registration attributes with 12 themes that enable efficient and accurate target extraction
*Japan Market Offering
-
ASIAN PANEL
One of Asia’s largest survey panels, with over 15 million people
-
Original Patented Survey Screen “i-Tile”
A unique survey interface that facilitates easy response on PCs, smartphones, and tablets to achieve high-precision data collection
-
Ethnography
Extracting essential needs and issues through the observation of unconscious behavior
-
Focus Group Interviews (FGI)
Collecting a wide range of opinions and ideas through group interviews
-
In-Depth Interviews (IDI)
One-on-one interviews to delve deeply into actual conditions and awareness and elicit true feelings
-
Central Location Testing (CLT)
Quantitatively collecting real-life evaluations of consumers by gathering people at venues to "see," "touch/use," and "drink/eat"
-
Home Usage Test (HUT)
Collecting user evaluations in the most closely resemble actual living conditions by having products used in their home environment
-
Visitor Survey
Conducting interview surveys and behavior observations on visitors to events and actual stores
-
SRI+® (Nationwide Retail Store Panel Survey)
A retail sales database that estimates nationwide FMCG sales from the sales performance of approximately 6,000 stores across the country
*Japan Market Offering
-
SPI (Nationwide In-Store Promotion Survey)
A retail in-store promotion database collected from SRI+® (national retail store panel survey) sample stores
*Japan Market Offering
-
SCI® (Nationwide Consumer Panel Survey)
A database that continuously collects daily shopping data from 70,000 male and female consumers nationwide
*Japan Market Offering
-
i-SSP® (INTAGE Single-Source Panel)
The largest single-source panel in Japan that comprehensively collects cross-media contact logs and purchase behavior from the same panelists.
*Japan Market Offering
-
SLI® (Nationwide Female Consumer Panel Survey)
A database that continuously collects shopping data related to beauty and health care from 40,000 women nationwide
*Japan Market Offering
-
Kitchen Diary®
A database that continuously captures dining and cooking state of 1,260 households for each meal occasion (breakfast, lunch, dinner)
*Japan Market Offering
-
Location-based Information Services
Utilizing one of the largest docomo base station data in Japan, providing survey distribution and population estimation data based on location information logs
*Japan Market Offering
-
International Sales Data
A database that enables understanding of international markets and consumers through consumer purchase and retail sales data
-
CONSUMER LIFE PANORAMA
A web-based database that accumulates visual data of over 1,000 consumers in 18 countries worldwide
-
Consumer 360° Viewer
Realistically understanding consumers by finely depicting their personalities, lifestyles, and experiences from vast stock data
*Japan Market Offering
-
Car-kit®
A consumer database that continuously captures the purchase and ownership of automobiles
*Japan Market Offering
-
UGO-kit®
Location-based platform service to support travel and tourism marketing
*Japan Market Offering
-
IPfan-kit®
Your IP marketing database for understanding fans of manga, anime and games
*Japan Market Offering
Case studies

CASE 01 :
Brand Management
Across Multiple Countries
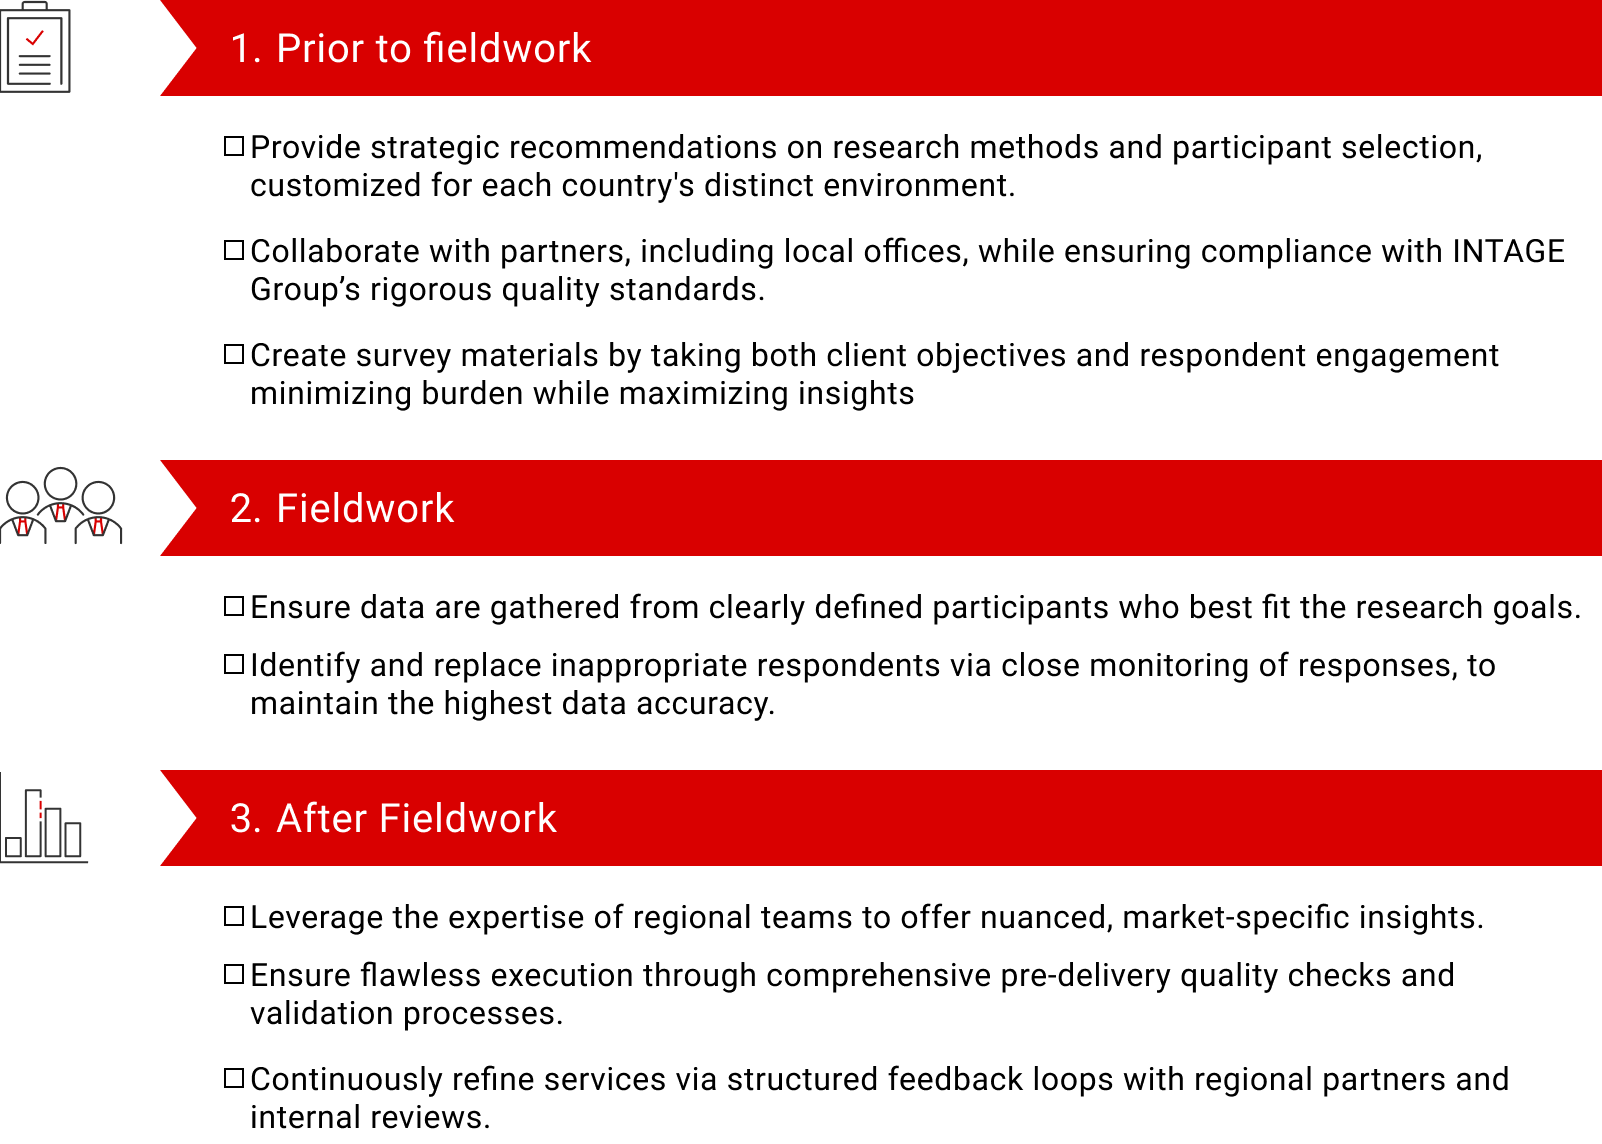
To achieve a coordinated branding scheme for a global brand, INTAGE conducted surveys across multiple countries using our extensive survey panels to manage and evaluate the brand based on common metrics. INTAGE Inc. in Japan acted as the central hub, overseeing the entire process to prevent discrepancies between countries and ensure the delivery of high-quality data.

CASE 02 :
New Product Development
for the Chinese Market
The client was developing a new product for the Chinese market, however, local consumer behaviors were unclear and they were unable to determine the target audience for the product. To quantitatively capture customer segmentation and needs, INTAGE led a project to implement a highly accurate STP (Segmentation, Targeting, Positioning) design. By combining strong research design capabilities with local insights, INTAGE was able to clearly define the target audience for the new product.

CASE 03 :
Prototype Testing
in the Indonesian Market
The client created a product prototype for the Indonesian market and INTAGE helped by having the locals taste and evaluate it. This feedback was used to refine the product's quality (taste, flavor, aroma) and localize it to suit the market. We fully leveraged the wonderful assets of INTAGE's local office, including its venue and recruitment networks, to create a high-quality research implementation system.
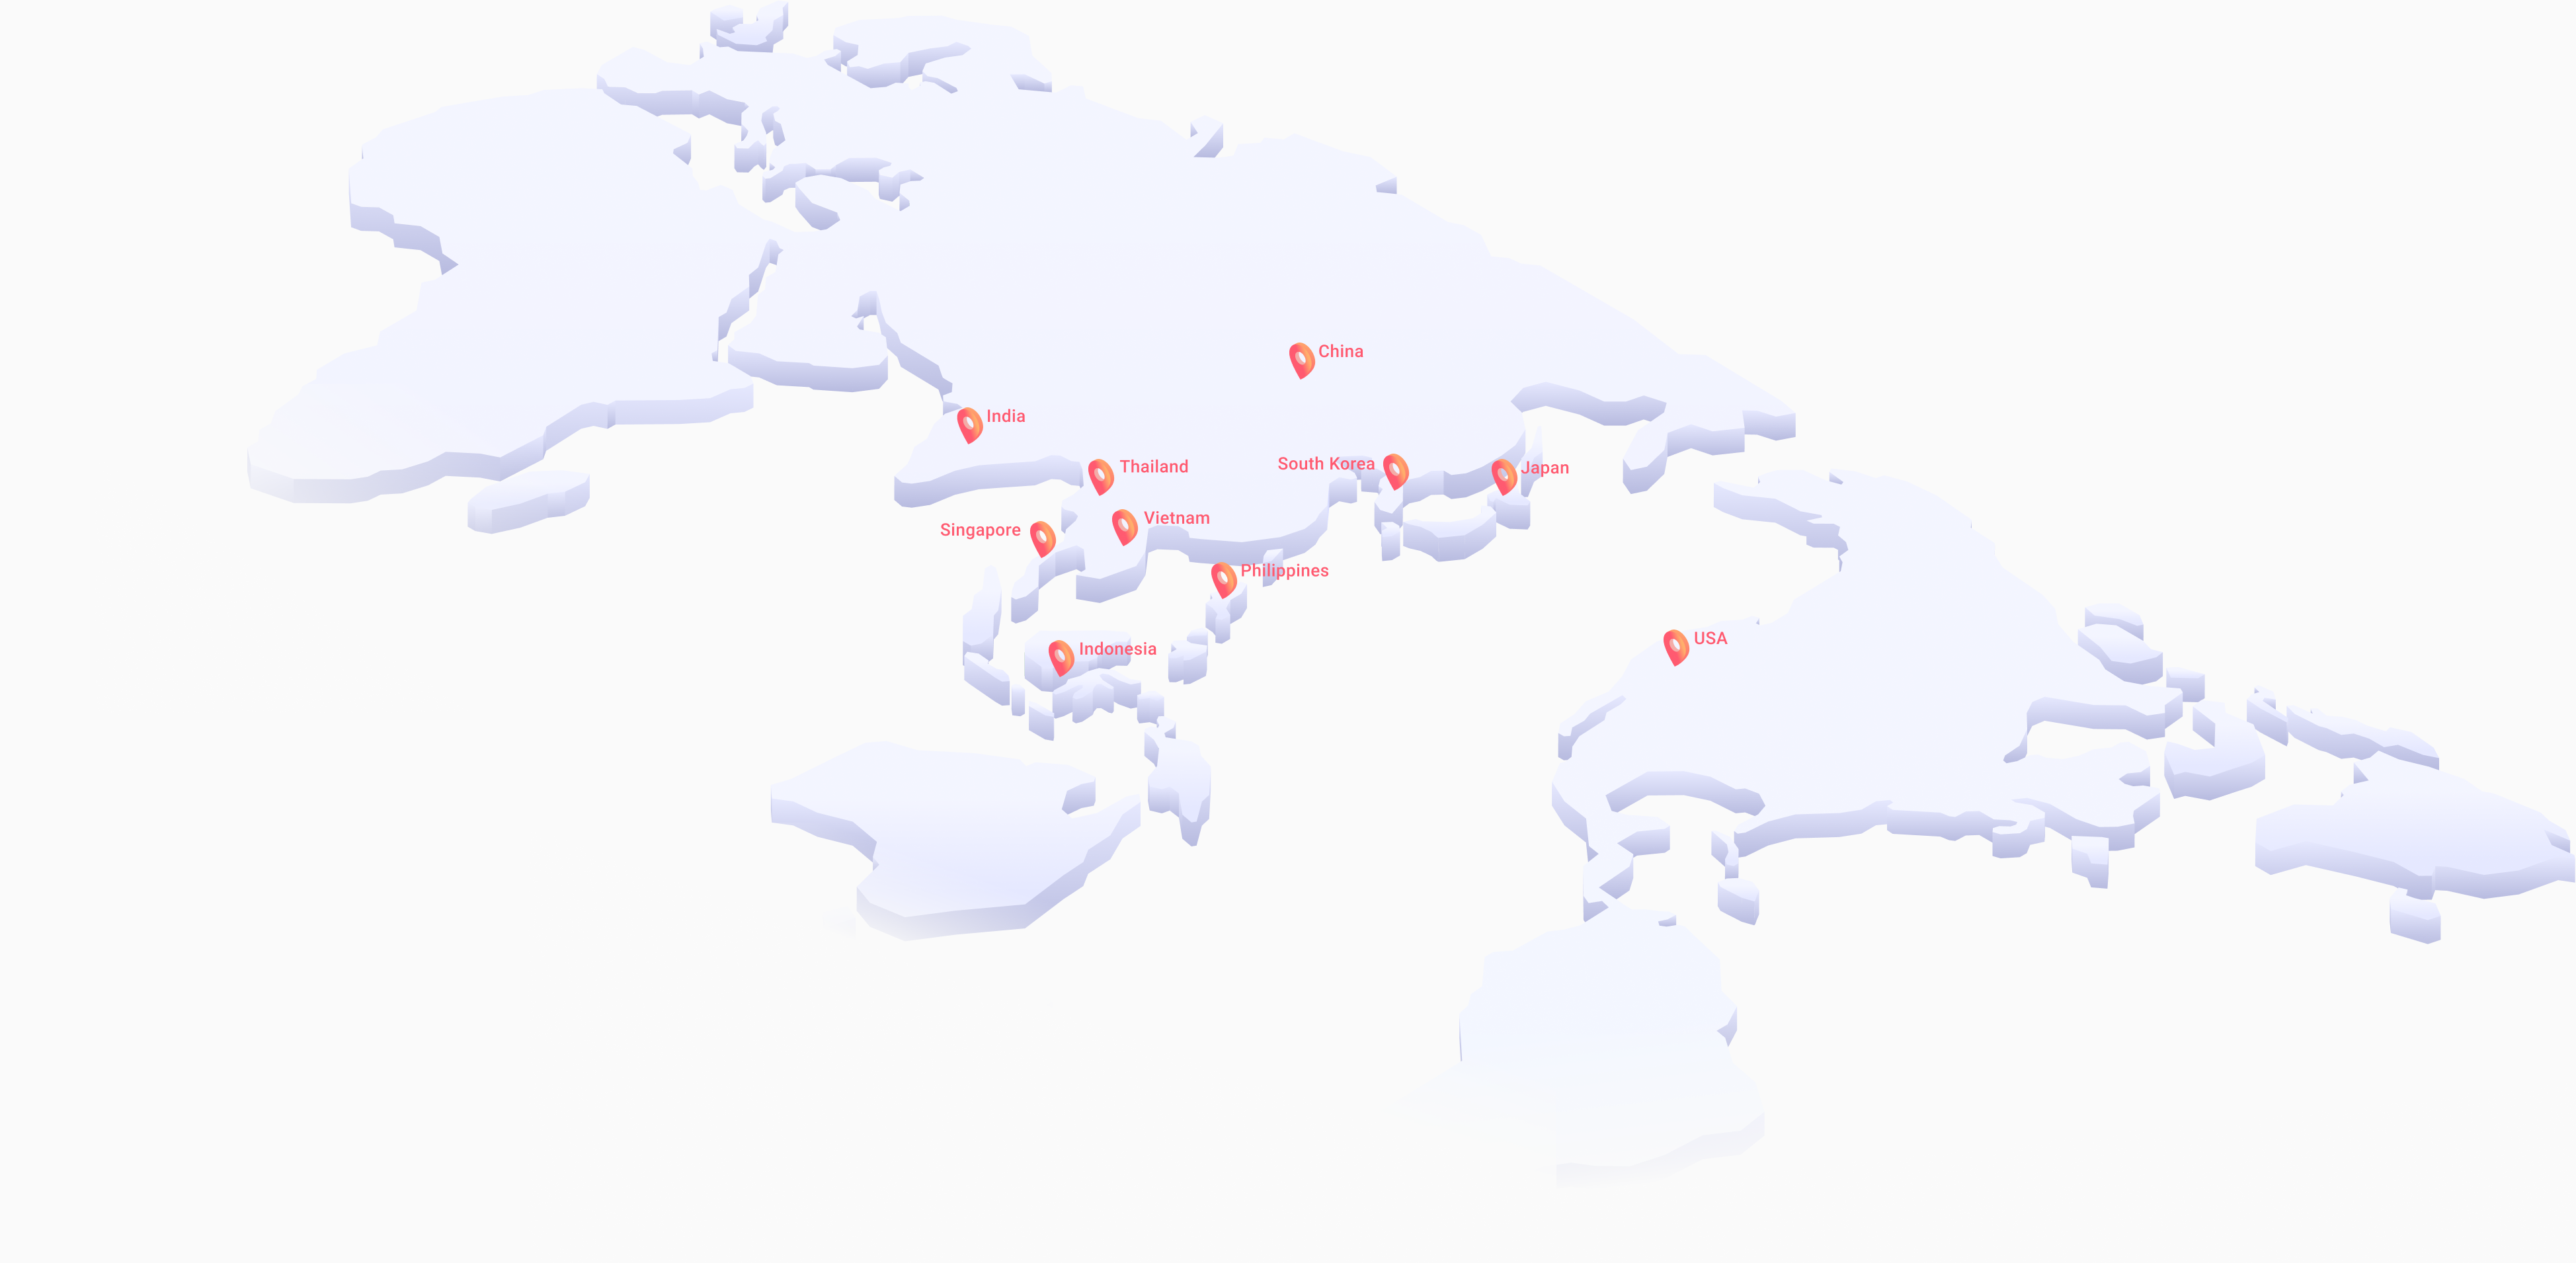
We are
locally present
With offices in the U.S. and across Asia,
INTAGE’s experienced researchers and analysts provide valuable,
local insights that give you a competitive edge.
Our in-person approach enables us to deliver real-time, actionable data,
offering a nuanced understanding of each region’s unique market dynamics.
We help you navigate complexities and make smarter,
more informed business decisions.


Contact us
For inquiries about INTAGE's products, services, and various types of surveys,
Please use the Inquiry Form to contact us for information on INTAGE's products,
services, and surveys, or to request materials or a quote.