SCI® (Nationwide Consumer Panel Survey)
Purchase log data-based shopping behavior of 70,000 people nationwide, presented in visual format for the achievement of consumer-centric marketing
Service Outline
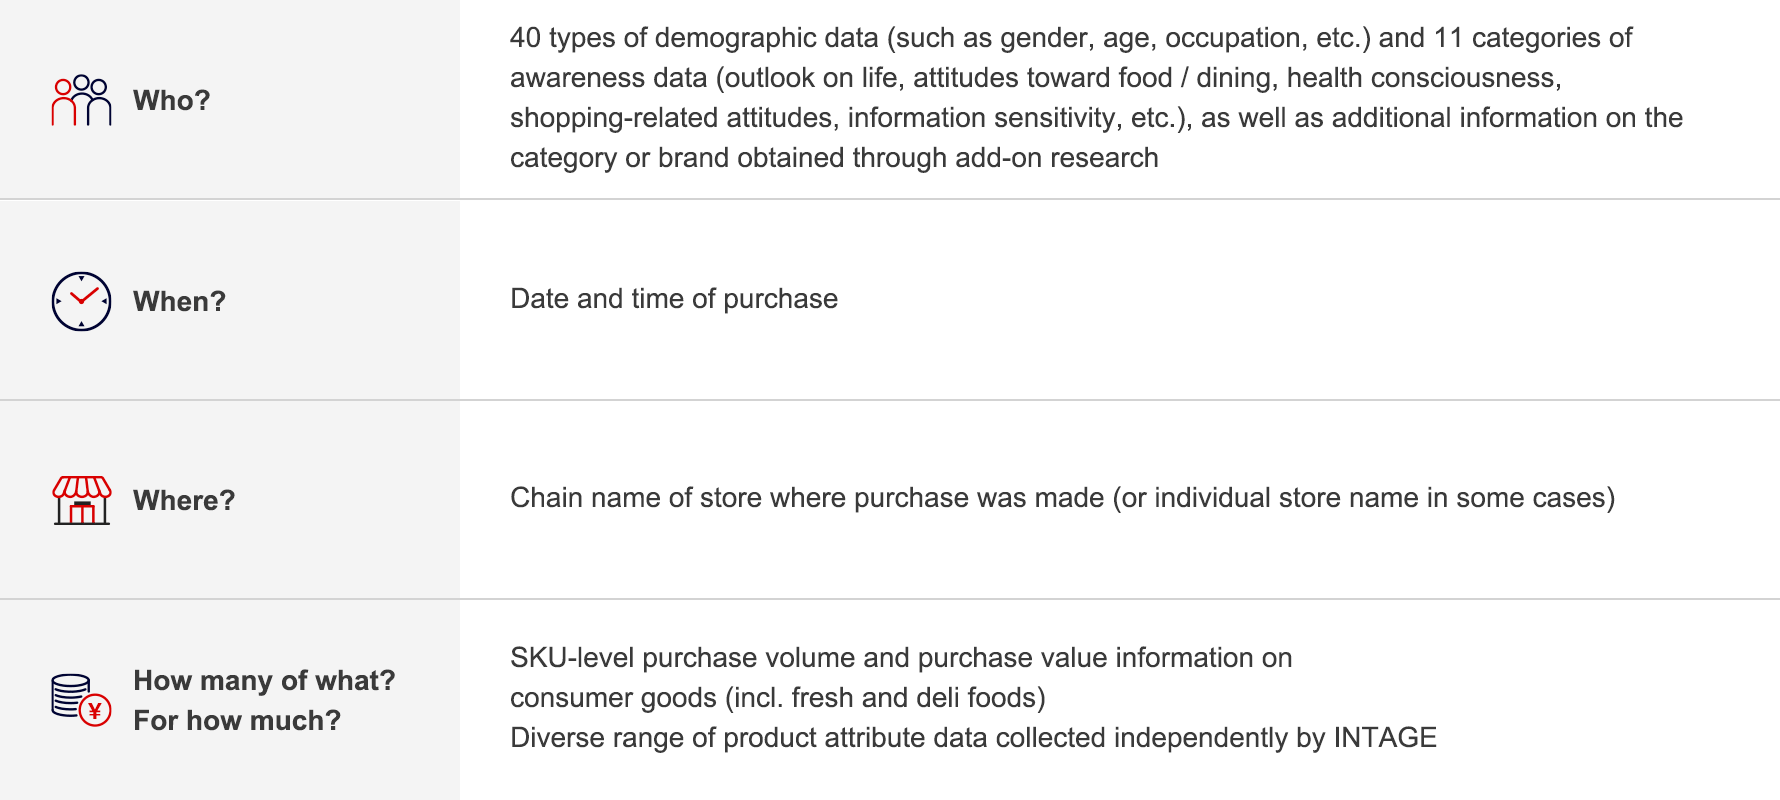
SCI is a database that accumulates daily shopping data collected on a continuous basis from 70,000 male and female consumers aged 15 to 79 across Japan.
Since it provides a detailed profile of consumers, it can be leveraged for consumer-driven brand marketing.
SCI can be used as basic data to support brand and retail marketing, for everything from understanding the market to identifying targets, considering approaches, and evaluating campaigns after they have been implemented.
SCI is useful for addressing a wide range of issues, including
- Identifying the factors behind the poor performance of your brand
- Finding a target demographic with high potential
- Checking whether your company’s “fans” are being retained
Characteristics of SCI (Nationwide Consumer Panel Survey)
High level of data accuracy
Stable delivery of data from 70,000 people is ensured through rigorous quality control.
Meticulous panel management and data cleaning are carried out based on expertise cultivated through the operation of consumer panels for over 60 years.
Supports a wide range of market and store analyses
Linking the shopping data to our independently-built product and store masters enables market analysis from a variety of perspectives, including analysis utilizing detailed store attributes.
Three optional survey services to deepen your understanding of consumers
Our three optional survey services capture the reasons and underlying attitudes behind purchase behavior.
● Profiler
Information on a wide range of values and attitudes, compiled and updated once a year
A wealth of profile information, with a focus on lifestyle and consumption values, allows you to gain a deeper understanding of your target consumers.
● Plus3
Three additional questions, asked when purchase data on the target product are entered
You can ascertain the reasons for purchase and/or in-store behavior while the experience is still fresh in consumers’ minds
● morevois
Sampling of respondents for a questionnaire survey using purchase history data
You can identify the “characteristics” of users from a variety of perspectives, such as their priorities when purchasing the category or their perceptions of the brand, and use this to understand the market and evaluate brands.
Deliverables
SCI data is provided using iCanvas®, a platform that allows you to easily analyze data and intuitively understand market trends with readymade visual templates supporting a variety of perspectives and approaches.
Excel tables, analysis reports, and other materials can also be provided as needed.