SPI (Nationwide In-Store Promotion Survey)
Panel data for in-store brand strategy development that can be used for checking the status of in-store sales promotion activities and measuring their effectiveness
Service Outline
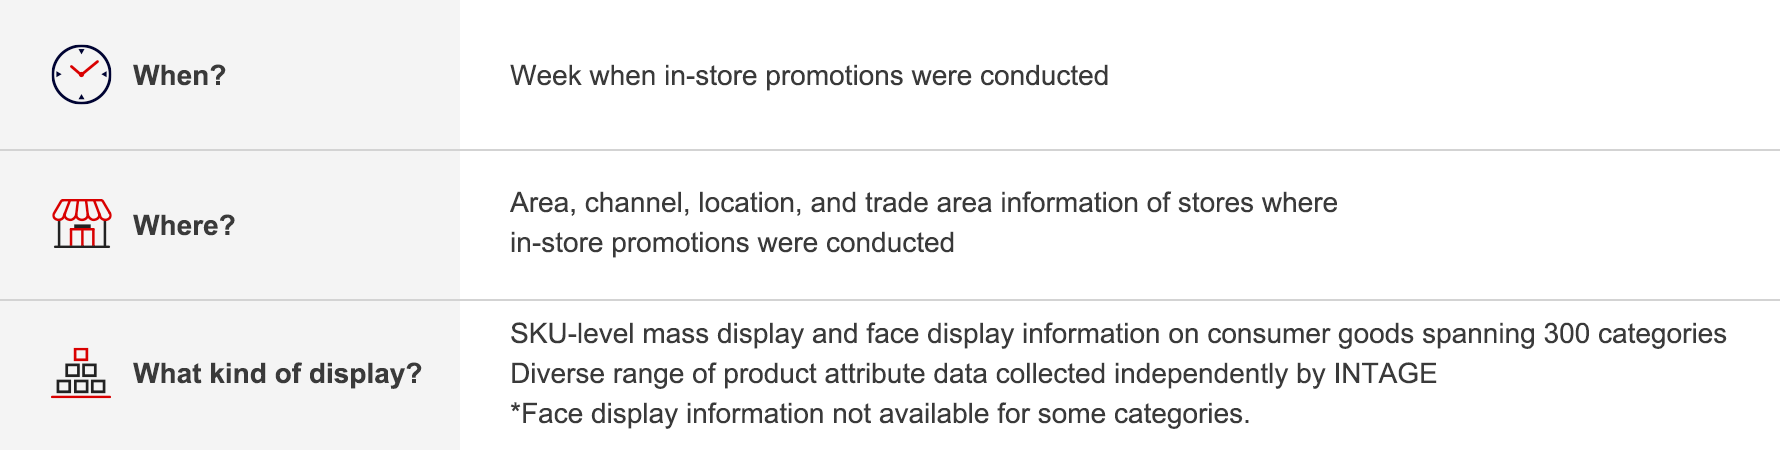
SPI provides data on in-store sales promotions collected from stores covered by the SRI+® (Nationwide Retail Store Panel Survey). Investigators visit the stores every weekend to check whether items are placed in mass displays, listed in flyers, or featured in video promotions, and to verify other shelf conditions such as the no. and depth of product “faces”.
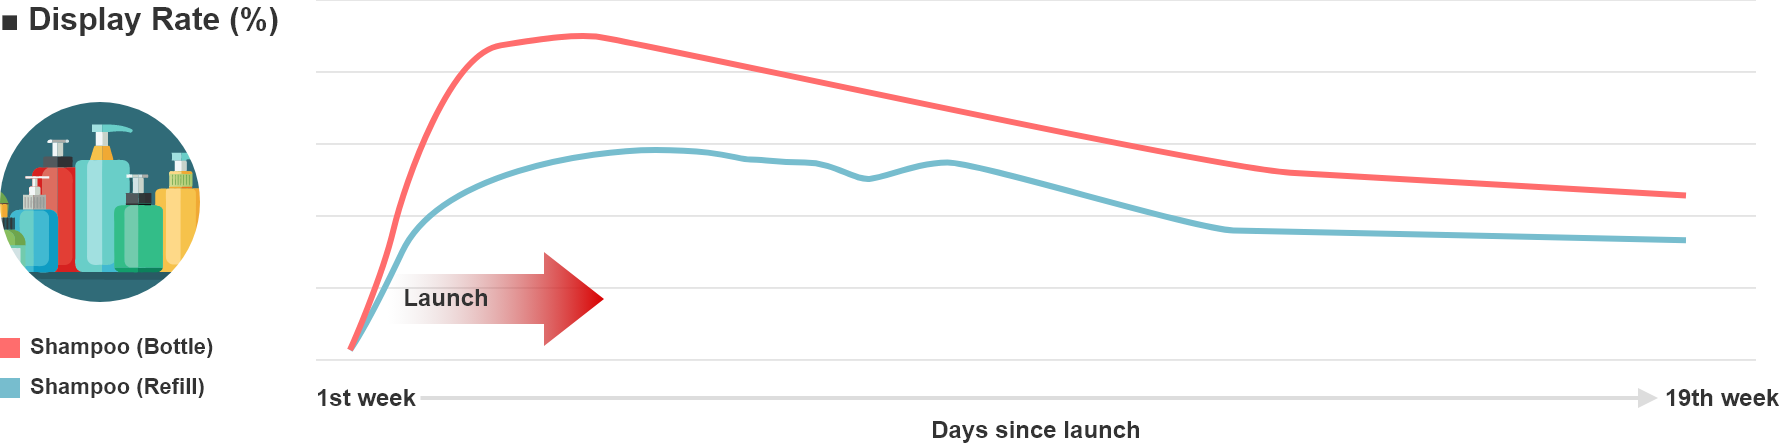
- You can check actual in-store conditions and see what kinds of in-store measures are being conducted for each product through metrics such as mass display and flyer promotion rates.
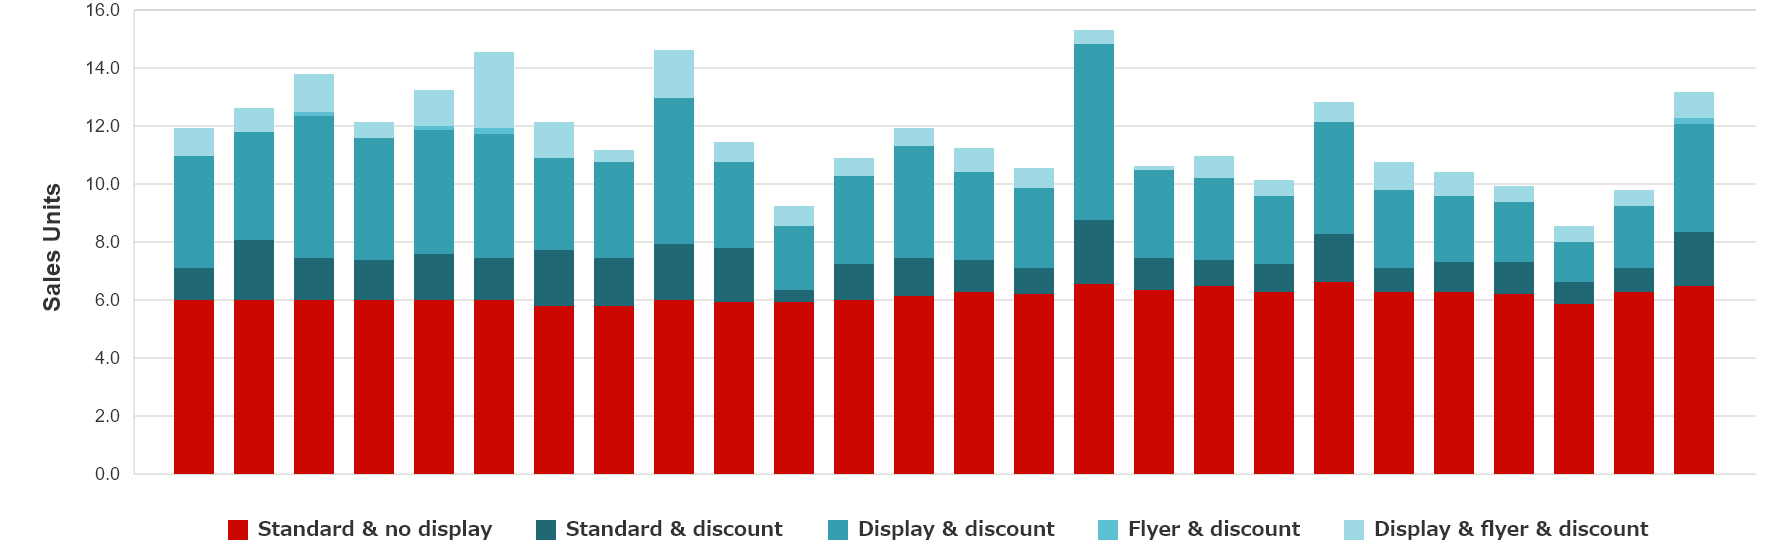
- You can evaluate the effectiveness of sales promotion activities by analyzing the relationship between promotions and SRI+ sales trend data.
- As an optional service, research addressing client-specific issues can be conducted to ascertain the status and effects of promotions for specific individual products, including data on display locations, fixtures, etc.
Characteristics of SPI (Nationwide In-Store Promotion Survey)
The only panel data on in-store sales promotion information in Japan
SPI is the only panel survey on in-store sales promotion information in Japan, made possible by INTAGE’s collaborative relationships with diverse retail chains nationwide. Since the survey is conducted every week, in-store changes over time can be tracked.
Causal information on sales data that is highly reflective of market conditions
SPI covers the supermarket, drugstore, and home center channels. The sample is comprised of around 400 stores, carefully configured by channel to take into account factors such as regional balance, chain balance, and store area.
A high level of data quality has been achieved through expertise cultivated over decades of experience in data management.
Analysis of correlation between in-store sales promotion and sales performance (optional service)
Since SPI covers the same stores as those in SRI+ (Nationwide Retail Store Panel Survey), analysis combining POS data and sales promotion data can be conducted.
Since it is possible to see whether or not sales promotions are being carried out at each retail store, factor breakdown can be conducted to estimate the contribution to sales when a product is sold on “standard shelves with no sales promotion”. The price elasticity for each type of sales promotion can also be checked.
Deliverables
SPI data is provided using iCanvas®, a platform that allows you to easily analyze data and intuitively understand market trends with readymade visual templates supporting a variety of metrics and approaches. Excel tables, analysis reports, and other materials can also be provided as needed.