
“Real-time video evaluation”
Get intuitive response by tapping the video)
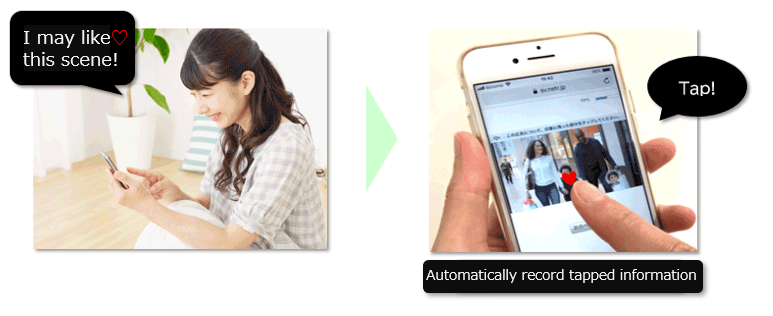
This service is the system using the interactive technology "TIG"*1, which enables viewers to evaluate the smartphone video that they are viewing for a web survey, just by tapping the video.
By quickly grasping the impressive scenes and objects during the video viewing by viewers, which is hardly evaluated by questionnaires alone, you can use the survey results to improve the quality of video creatives.
*1"TIG" is the video technology planned and developed by Paronym Inc., which allows viewers to instantly stock and access information only by "touching" the items, music, food, people, locations, or something that interests them while watching a video.https://www.paronym.jp/
Characteristics of real-time video evaluation service
Three characteristics of this service
- The intuitive responses of viewers during their watching of videos can be clearly obtained for each element of the video!
- By combining the viewers’ responses with quantitative survey, you can analyze the viewers' responses and check the responses by viewers’ attributes!
- This is a web survey (mobile only), so it can be done quickly and at low cost!
With this service, you can count the number of viewers’ taps of the video as their intuitive responses; additionally, you can access the information by tapped element about "which elements (e.g. faces of characters, product logos in the video)" "In which scene of the video" and "how many times did viewers tap?"
For this, we ask the viewers to tap "memorable elements", "elements that they think good or that they like", and "elements that they think are not good or that they don’t like" in the video. Tap status can be checked with outputs such as "heat map of tapped areas" and "time series chart of tap occurrence".
[Output: Heat map of tapped areas]
*You can see the image by playing the following video
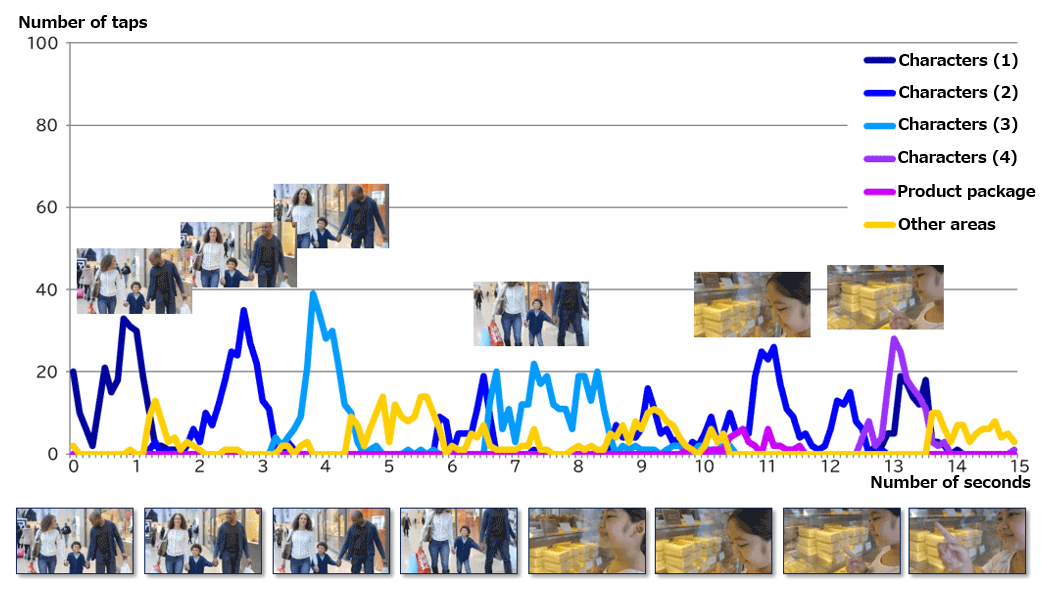
[Output: Time series chart of tap occurrence]
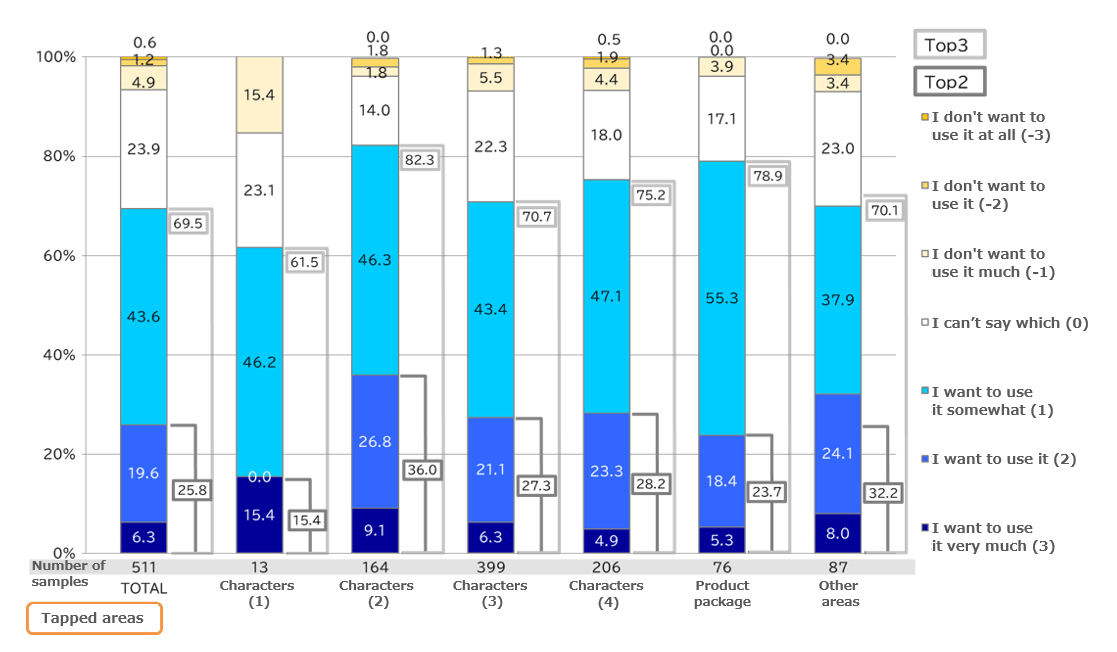
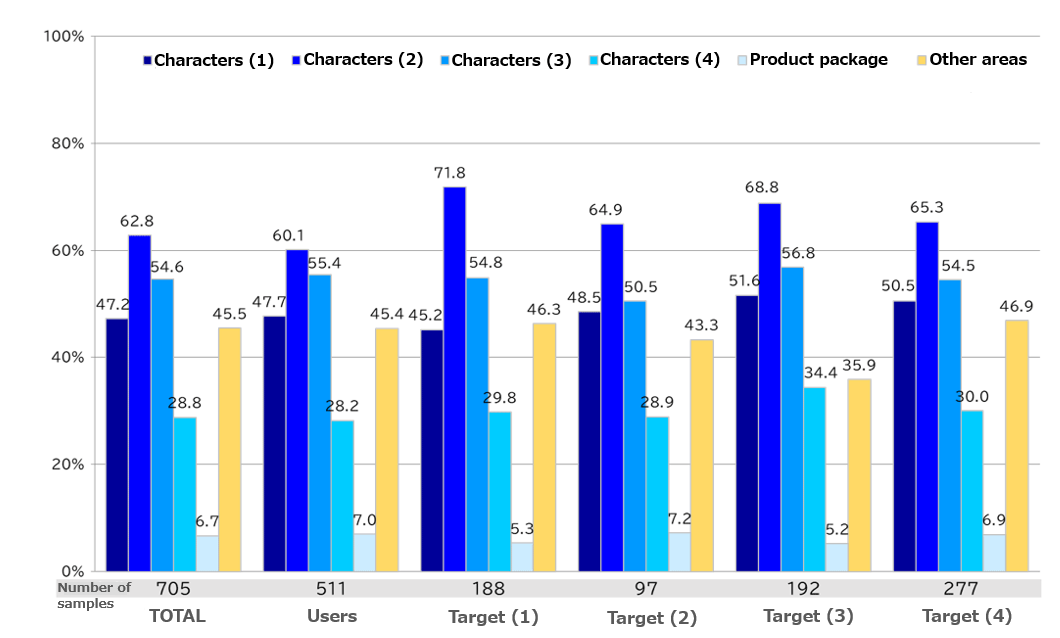
By combining this with quantitative survey, you can ask the viewers in-depth questions such as why the elements were selected to tap and how the viewers preferred the elements, as well as checking the tap status of elements by viewers’ attributes. The results can be checked in the following 2 outputs. (*Please consult with us about details on outputs.)
[Output example in combination with quantitative survey: usage intention by viewer who tapped the elements]
[Output example in combination with quantitative survey: tap status of the elements by viewer’s attribute]
One of the advantages is that measuring taps does not require special equipment and long-term setup work, so it can be done quickly and at low cost in the form of a web survey.
Application image of the real-time video evaluation service
It's perfect for customers who have the following issues.
- We would like to speed up the PDCA cycle of the creative production process
- We would like to strictly evaluate the elements such as each scene and character in the video produced, so that we can effectively improve the quality of scenes
This service is ideal for creative evaluation to apply the PDCA cycle quickly, because the service allows users to check the viewers’ evaluation about the elements of the video such as the viewers’ likes or dislikes during their viewing, which was previously checked after viewing. In addition, the service can be implemented in a short time.
You can use this service easily and widely for creative evaluation for all kinds of videos such as TV commercials, TV programs, and web videos.
Standard output plans
This service provides the following two standard outputs introduced in the "characteristics" section.
Please consult us about other outputs, such as the one combined with quantitative survey results.
- (1)
Heat map of tapped areas
You can easily check the areas rated (tapped) by viewers in our video. The closer the color is to red, the greater the number of viewers who tapped the element. - (2)
Time series chart of tap occurrence
You can see at a glance the number of taps from the start of the video. In addition, "number of taps by element in the video" can be output.
(*You need a setting for the output before the research starts.)
We propose the sort of marketing research that can deal with your company's challenges.
Please feel free to contact us. The relevant team member will get in touch with you.